A company’s dividend growth rate (DGR) is its percentage growth over time. DGRs are often calculated annually. It can be calculated quarterly or monthly if needed. Dividend growth is crucial to a company’s long-term prosperity. The company’s DGR can be used to evaluate its capacity to maintain profitability because dividends are paid from earnings. The dividend discount model requires dividend growth rate calculation. Securities-pricing models include dividend discount. According to the dividend discount model, a stock’s price is determined by the extra internal growth over the company’s expected dividend growth rate. The dividend discount model considers a firm undervalued if its dividend discount number exceeds its share price. Using the dividend discount model, investors estimate the future cash flow value to determine a stock’s intrinsic value.
A company’s long-term profitability depends on its dividend growth history. Investors can apply any period to find dividend growth. They can also calculate dividend growth via the least squares method or a simple annualized figure. Let ABC Corp pay stockholders $1.20 in 1st year & $1.70 in 2nd year. The below formula will calculate the dividend growth rate from year one to year two:
DGR= $1.70/$1.20 = 41.67%
We require the progressive growth rate to calculate the dividend discount model’s growth rate.
A dividend is a company’s shareholder who receives a percentage of its earnings as dividends. The board of directors sets quarterly dividends depending on the company’s latest earnings. Cash or shares might be considered as dividends. An organization’s dividend announcement includes the payout date to shareholders. Dividends are a company’s profits dispersed to shareholders. Thus, it is the company’s profit-based return on a shareholder’s shares. The Institute of Chartered Accounts defines a dividend as “Distribution to a shareholder out of earnings or reserves available for this reason” (Dividend Analysis At Kesoram Industries Ltd, K. Sree, K. Balaji, V. Rangaiah, 2019).
A stock’s dividend yield is its dividend amount per share as a proportion of its share price, such as 2.5%. Some corporations don’t pay dividends to common shareholders. Preferred shareholders receive a fixed dividend.
A firm pays its shareholders a dividend as a return for buying stock. Consider owning a piece of your favourite software company or apparel brand and getting a small percentage of their revenues for holding stock. Companies pay dividends to attract and satisfy new and existing investors.
What is the Dividend Growth Rate (DGR)?
A company’s dividend growth rate (DGR) is the percentage of growth it achieves and earns over a given period. Dividend growth is usually calculated annually. However, the corporation might choose to compute quarterly or monthly. Companies also enhance shareholder dividends as their profits rise.
Additionally, a company with a strong dividend growth history will likely boost dividends in the future. This dividend predictability might also show long-term success. Thus, dividend rates might be a key indicator of whether you invest in the correct firm and expect gains. Please read on to better understand the dividend growth rate.
A trader or investor must understand how the dividend growth rate is determined to employ the dividend discount model. What is the dividend discount model? This model assumes the company’s current share price equals its future net present value dividends. For stock valuation, the dividend discount model is utilized.
This strategy requires investors and traders to subtract the company’s excess internal growth rate. This surplus growth rate is the greatest a company can achieve without outside funding. This internal growth rate should be subtracted from the expected dividend growth rate to determine a stock’s price. This model states that a stock is undervalued if its current price exceeds its calculated price. Income and free cash flow models describe little dividend growth rate changes, but managers focus on revenue and the cost of goods sold growth (How Do Managers Manage Dividends Growth Rates?, T. Eldomiaty, O. Atia, Wael Abdallah, 2014).
The dividend growth rate, along with the dividend discount model, uses the formula:
P0 = D1/r-g
P0 is the company’s stock price, D1 is the following year’s dividends, and r and g are the cost of equity and dividend growth rate, respectively.
How to analyze DGR?
To analyze DGR by using the AM (arithmetic mean): Record the company’s dividend payments to investors. The company’s annual business reports contain this information. Compare the eras by calculating the difference. You can also evaluate industry competitors’ DGRs. You can calculate using the arithmetic mean formula. After getting your results, you can calculate the company’s profitability.
Are dividend yield and dividend growth different from each other?
Yes! Dividend yield and dividend growth are different from each other. An investor receives a dividend for every financial year from owning shares of a corporation or other dividend-yielding assets. Another term for Dividend is dividend rate. When individuals talk about dollar dividends in the media or elsewhere, they mean the dividend rate. Dividends from stocks can also be reported as a percentage of dividend yields. Given the current share price, the dividend yield is the expected per cent return on an investor’s investment. Investors pick dividend-paying organizations because they provide a good income. Investors receive dividends from companies with large cash flows that don’t need to reinvest.
The dividend yield is a company’s annual dividend divided by its share price. The dividend yield rises when the dividend stays the same, but the share price falls. Yield falls when stock price increases. Divide the annual dividend by the stock value and multiply by 100 to get the dividend yield. However, dividend yield calculation is complex. Dividend yields vary generally; therefore, the computed Yield cannot influence future ROR. Dividend yields are oppositely bound to share price. Therefore, a rise in Yield merely because the stock price is falling can be undesirable.
What is the relation between Dividend Growth Rate and Security Pricing?
Security pricing models include the dividend discount plan. Under this plan, the price of a stock is based on its expected future dividends minus the difference between internal growth and the company’s expected income growth rate.
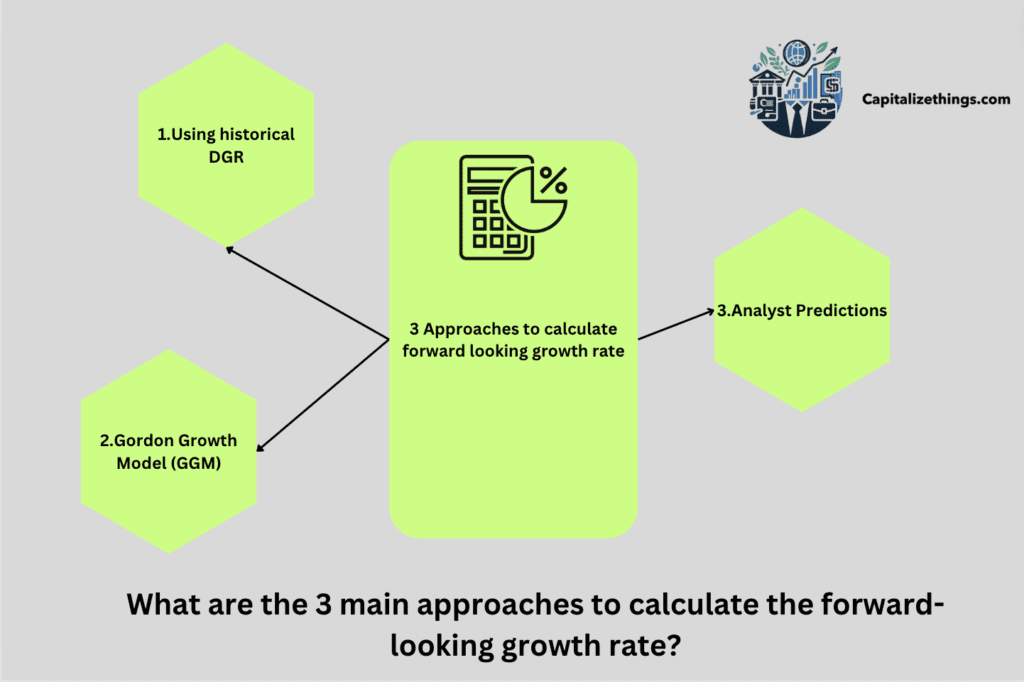
What are the 3 main approaches to calculate the forward-looking growth rate?
The 3 main approaches to calculate the forward-looking growth rate:
Using historical DGR
Gordon Growth Model (GGM)
Analyst Predictions
1. Using historical DGR
Historical growth rates are applied to forcast growth in the future. This assumes that past firm performance predicts future performance.
Historical DGR Formula:
Forward_looking Growth Rate = (Current Value/Value N Years ago)1/n – 1
Where N is the number of years for which the growth is estimated.
2. Gordon Growth Model (GGM)
This approach is used to value dividend-paying firms and implies steady dividend growth.
Formula of Gordon Growth Mode:
g = ROE * Retention Ratio
3. Analyst Predictions
Financial analyst growth estimates underpin this method. Analysts employ a mix of qualitative and quantitative techniques to predict future growth. Analyst estimates use thorough industry analysis, financial modelling, and company-specific elements; therefore, there is no formula.
What is the GD stock dividend growth rate?
Over the previous 12 months, General Dynamics Corporation (GD) dividend payouts per share averaged 6.20%, 7.04%, 6.16%, and 8.79%. GD’s dividend history and growth depend on cash flow, profitability, financial health, growth forecasts, and dividend distribution policies. Be aware of updates by watching GD.
Formula to calculate Dividend Ratio:
Dividend Payout Ratio = Dividends per Share / EPS without NRI
Formula to calculate dividend yield:
Dividend Yield % = Most Recent Full Year Dividend / Current Share Price
What is a reasonable 5 year dividend growth rate?
Industry, firm size, and financial circumstances affect a 5-year solid dividend growth rate. Healthy dividend growth rates are usually between 5% and 10% annually. This range indicates robust economic health and management confidence in future earnings as the company continuously raises its dividend distribution. Higher, established businesses have lower but reasonable dividend growth rates, whereas smaller, faster-growing companies aim higher as they develop. Shareholders must assess the company’s long-term dividend sustainability and potential to boost dividends.
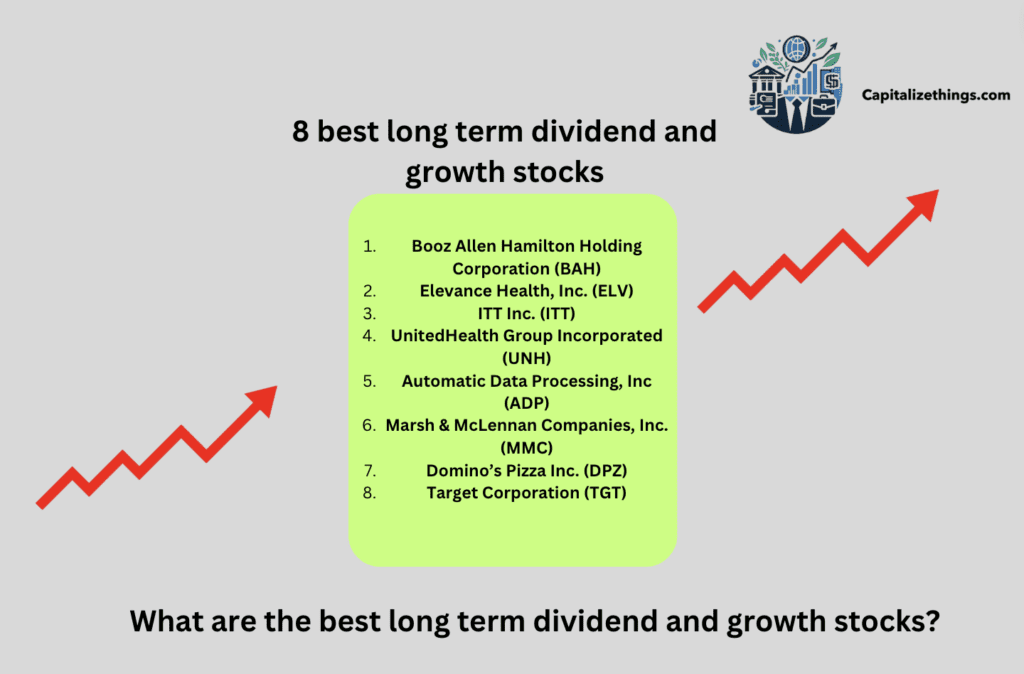
What are the best long term dividend and growth stocks?
8 best long term dividend and growth stocks are the following:
Booz Allen Hamilton Holding Corporation (BAH)
Elevance Health, Inc. (ELV)
ITT Inc. (ITT)
UnitedHealth Group Incorporated (UNH)
Automatic Data Processing, Inc (ADP)
Marsh & McLennan Companies, Inc. (MMC)
Domino’s Pizza Inc. (DPZ)
Target Corporation (TGT)
What does 5% CAGR mean?
CAGR5% measures investment or business growth over time. It considers compounding, which creates growth. An Rs 1,000 mutual fund grew 10% over five years. This indicates that your investment rose 10% annually on average. However, annual growth can differ. The first year could be 8%, the second 12%, etc. CAGR smoothes out variations, giving you a steady growth rate for comparison.
The CAGR lets you analyze investment opportunities or past performance. It helps you regularly compare investments and generate informed selections. It enables you to follow your money’s consistent growth. CAGR evaluates the average yearly growth rate and compares investments more precisely because it accounts for compounding.
Formula to generate CAGR:
CAGR = (Ending balance/beginning balance) 1/n – 1
Is 100% CAGR good?
Yes! Company growth depends on industry and size. Large-cap enterprises benefit from 5-12% sales CAGR. Small enterprises benefit from 15%–30% CAGR. However, start-ups have 100% to 500% CAGR.
What is the 70 growth rate?
The Rule of 70 is a basic mathematical formula that estimates the time a constant-growth number takes to double. The ‘doubling time formula’ estimates when it takes a constant growth variable to double.
Is dividend growth good?
Yes! Dividend growth is good. A solid dividend growth history could mean that future dividend growth is expected, which can signify that a company will be profitable in the long run.
What is the dividend growth rate of S&P Global?
S&P Global Dividend Growth Rate is 12.80%.
What is the Dividend of P&G NSE?
Annual Dividend is $4.026. Dividend Yield is 2.39%. P/E Ratio is 28.13.
Is P and GA a good investment?
Yes! P and GA is a good investment. It is considered a excellent investment for many reasons. Market-share leadership doesn’t guarantee a good stock. On the other hand, category leaders frequently lead for good cause. The product is excellent, and the corporation understands its marketing. To this purpose, P&G dominates vital consumer product categories. Pampers diapers, Gillette razors, Tide laundry detergent, and Crest toothpaste are among its products. Nearly a dozen of its brands lead U.S. revenue by a significant margin.
Bounty paper towels produce five times the annual income of its nearest competitor. Same for Gillette! Recognize that P&G is doing well. Leading several markets doesn’t guarantee a purchase of the firm behind those leading products. It’s hard to overthrow a category leader when buying their items becomes a habit.
If a corporation doesn’t handle bureaucracy and complexity, scale might be a disadvantage. P&G manages its weight well. The organization evaluates and restructures as needed to eliminate the unexpected bloat that might occur when a major corporation needs to look.
Does the dividend growth rate affect stock price?
Dividend growth rate affect stock price like cash dividends, but investors receive no immediate value boost. With a stock dividend, the number of shares outstanding increases while the company’s value remains steady, diluting the book value per common share and lowering the stock price. Just like with cash dividends, it’s easy to miss smaller stock payouts. In a typical trading, A 2% stock dividend on $200 shares reduced the price to $196.10. A 35% stock dividend lowers the price to $148.15 a share, making it hard to ignore.
What is the difference between dividend yield and dividend growth model?
Dividend yield often results from dropping stock prices or financial manipulation, which increases volatility and risk. Dividend growth and Dividend yield have different risk profiles according to payout ratios and debt levels. Dividend yield have a high dividend payout ratio because they distribute a lot of free cash flow. High-yield equities use debt to fund dividends, increasing leverage and hazard. Both considerations could lead to a dividend decrease during stress, decreasing an investor’s earnings and exposing them to large stock price drops.
Dividend growth stocks are safer and yield higher returns. Despite lower yields, they have strong growth potential. Dividend growth raises Yield on Cost. Dividend Growth stocks have low payout ratios, strong balance sheets, and little leverage, reducing risk. This lets them raise dividends in tough times. Dividends rise over time, providing a steady income for lifestyle and retirement expenditures.
What is the difference between the dividend discount model and the dividend growth rate?
The difference between dividend discount model and dividend growth rate is that a company’s stock price can be predicted using the dividend discount model (DDM), which holds that its current price is worth the sum of its future dividend payments discounted down to its current value. The DDM calculates stock fair value regardless of market conditions. It considers dividend payout and market returns. If the DDM value is higher than the current trading price, the stock has a low valuation and purchase. Whereas a company’s dividend growth rate is its stock’s percentage growth. Since firms raise dividend payouts over time, this rate is usually calculated annually. One can estimate stock market dividend growth quarterly, half-yearly, or monthly if needed.
What is reasonable revenue growth?
Standard growth rates depend on the stage of a business, but most companies fall between 15%-45% for year-over-year growth.
What is growth at a reasonable price GARP strategy?
Growth at a reasonable price (GARP) is an equity stake technique that uses growth and value investing to pick stocks. GARP investors exclude companies with high valuations and strive for persistent earnings growth above market norms. The idea is to avoid extremes in growth or value investing. Consequently, GARP investors often buy growth stocks with low P/E multiples in normal markets.
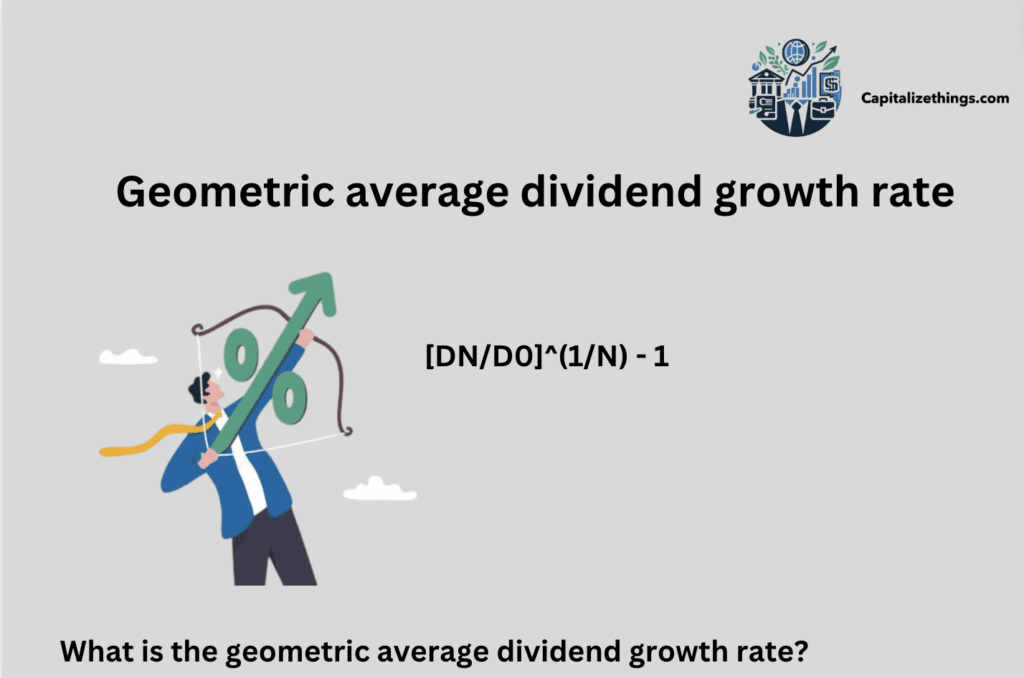
What is the geometric average dividend growth rate?
Geometric average dividend growth rate equals:
[DN/D0]^(1/N) – 1
The starting Dividend is D0, the final Dividend is DN, and N is the number of periods. To get the average growth rate per period, use the Nth root of the fractional dividend increase over N periods minus one.
What is the Formula for Dividend Growth Rate (DGR)?
The formula for dividend growth rate is dividend of current year divided by dividend of the last year – 1. What length of time do you want to calculate a stock’s dividend growth rate (DGR)? To compute the 3-year DGR, you need the past four years’ yearly dividends. Then, a basic computation will be applied to calculate the growth rate (ideally) between two years. For instance, this equation can calculate the latest growth rate.
It is a simple equation indicating % gain (or reduction) between two years. To include more years, repeat this technique for each annual interval and take the average.
Formula terms:
Annual Dividends: Total of four quarterly payments each year.
Quarterly Dividends: Fiscal quarter-end payments.
What is the Dividend growth rate formula for Excel?
The formula for calculating the Dividend Growth Rate in Excel:
[(Ending Dividend per Share / Beginning Dividend per Share) ^ (1 / Number of Years) – 1]
Check dividend numbers and years for an appropriate rate. Dividend growth is a standard indicator of stock investment potential. Measuring the Dividend Growth Rate is crucial to analyzing a company’s financial health and future. This rate indicates a company’s sustainable growth and aids investment decisions.
Historical data is rapidly converted into a percentage growth rate using the Excel formula, which is assimilated to industry benchmarks or other investment opportunities. With proper study, the Dividend Growth Rate may help experienced and novice investors make more innovative, data-driven investments.
What is the formula for growth rate from ROE?
To calculate growth rate from ROE:
The sustainable growth rate is the company’s return on equity times one minus the dividend payout ratio. Multiply the retention rate by the ROE. The retention rate is the percentage of earnings not distributed as dividends. It’s the same formula stated differently.
What is the constant dividend growth formula assumes?
The constant dividend growth formula assumes:
P0 = Div1/(r − g)
What is the zero dividend growth formula?
The formula for zero dividend growth is:
Zero dividend growth formula = Annual Dividends / Required Rate of Return
Preferred stock, which generates a dividend of a certain proportion of its par value, can be priced using the same technique as perpetuity. A stock based on the zero-growth concept might alter price if the necessary rate fluctuates with perceived risk.
What is the Two-stage growth model formula?
The two-stage dividend discount model indicates a dividend increase in two phases. In the first stage, the payout grows steadily for a set time. The second assumes the Dividend will grow at a variable rate during the company’s life. The second half of the two-stage model is almost identical to the Gordon Growth Model; understanding the more straightforward formula can help you understand the more complex formulas. A fast-growing company’s stock is commonly valued using the two-stage approach. This valuation strategy works well for newer companies that have shown resilience but are still increasing. As the company overgrows, the first step of two-stage dividend growth is anticipated to be aggressive, while the second stage anticipates a slower, more sustainable rate.
Like the Gordon Growth Model, the two-stage dividend discount model requires little data to calculate. All you need is the expected dividend payment one year from now, the necessary rate of return, and the expected dividend growth rates.
This formula appears intimidating, but it’s simple once all variables are set. The dividend growth rate for stage two is G2, and the dividend to be paid one year from now is D1. The discount rate (anticipated return) is equal. Finally, N is the duration of the initial dividend growth rate.
Two-stage dividend discount models can yield more accurate valuations than straightforward methods, but they inherit some drawbacks from the Gordon Growth Model. First, both models assume continual growth, which rarely matches dividend growth. The two-stage model accounts for different growth rates but assumes the switch occurs overnight rather than a progressive fall between the aggressive first growth rate and the moderate second growth rate. All dividend models fail to account for outside influences like public sentiment and corporate innovations that affect stock prices. These assessments only consider dividend payments and do not accurately reflect stock value.
What is the Zero growth dividend model formula in Excel?
Zero growth dividend model formula in Excel: The simplest dividend discount model assumes the dividend growth rate remains constant forever, and the share price is the yearly dividend divided by the discount rate.
What is the Variable growth model formula?
Variable growth model formula:
Dt= D0×(1 + g1 )t
Is it better to invest in dividend stocks or growth stocks?
Yes! It is better to invest in dividend stocks or growth stocks. Dividend stocks offer good returns over upside potential. Stocks with solid growth potential invest all earnings. These businesses have the best value growth prospects. Stocks that pay dividends are suitable for buyers in several ways. First, retirees and other income-focused investors can like their consistent income source. Second, dividends represent a company’s financial health and stability because they suggest it’s making enough money to pay shareholders. Reinvesting dividends can boost long-term investment growth by compounding profits. Lastly, dividend-paying stocks can defend against dropping stock prices in stormy markets due to their dividend yield. Your investing horizon, risk tolerance, and financial needs determine how much to focus on dividend-paying stocks.
What does DGR mean in investment?
Company dividend growth rate is the yearly percentage change in dividends paid to shareholders. High dividend growth rates reflect robust and sustained earnings and confidence in the company’s future. However, a low or negative dividend growth rate indicates financial trouble or cash flow reallocation.
What is the Investment appraisal dividend growth rate formula?
Dividends are risky and vulnerable to macroeconomic and corporate factors. Another drawback is that dividend-paying stocks are rarely high-growth leaders.
Are dividend stocks the best to invest in as a beginner?
Yes! Dividend stocks are the best to invest in as a beginner. Dividend stocks are fine for beginner investors but should be mixed with mutual funds, bonds, and ETFs. Consult with a financial advisor to prepare a portfolio that meets your goals.
Is it better to take dividends or reinvest?
Yes! It is better to take dividends or reinvest. If a company thrives and your investment portfolio which is also diversified is in profit, reinvesting dividends is better than taking cash. When a firm struggles or your portfolio gets unbalanced, removing the cash and investing it elsewhere can make more sense.
What is the dividend growth rate valuation?
Company stock is valued using the dividend growth model, don’t consider market conditions. The model ignores intangible factors like brand and reputation. Instead, stockholders’ dividends are highlighted.
Conclusion:
Dividends are firm profits distributed to shareholders. Calculating the dividend growth rate requires dividend periods. The GDR is how much the dividend has increased over the past year. For example, if the Dividend in 2018 is $2 per share and in 2019 it is $3 per share, the Dividend has grown by 50%. Companies usually pay quarterly or yearly dividends. Investor portfolios benefit from dividends’ steady income, especially when a company hasn’t appreciated substantially. Understanding a company’s dividend philosophy and growth can help shareholders make intelligent investments. Using the dividend growth rate calculations can aid investment decisions.
Larry Frank is an accomplished financial analyst with over a decade of expertise in the finance sector. He holds a Master’s degree in Financial Economics from Johns Hopkins University and specializes in investment strategies, portfolio optimization, and market analytics. Renowned for his adept financial modeling and acute understanding of economic patterns, John provides invaluable insights to individual investors and corporations alike. His authoritative voice in financial publications underscores his status as a distinguished thought leader in the industry.


: Definition+Formula+Example and Drawbacks")


