Gordon’s growth model (GGM) predicts a stock’s intrinsic value based on a future sequence of constantly growing dividends. Profitable and simple, it’s a dividend discount model version. The GGM calculates the present value of infinite dividends, assuming a constant growth rate. Companies with consistent dividend per-share growth rates utilize the model because it implies a constant growth rate.
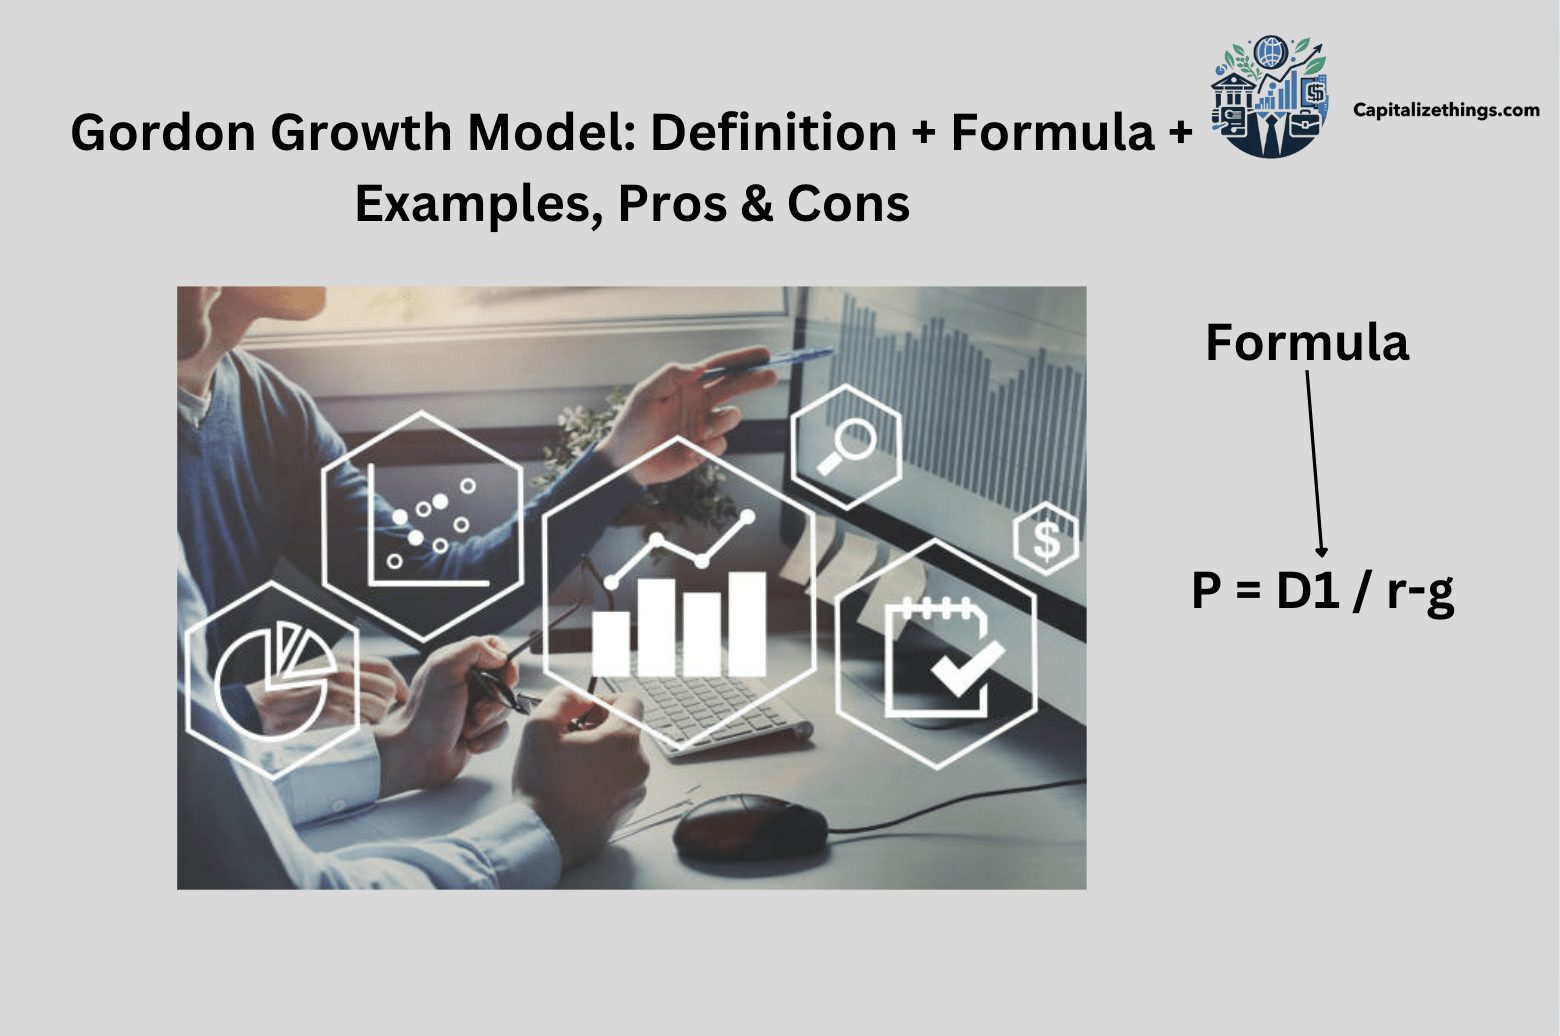
Gordon’s growth model formula uses mathematical features of an endless series of numbers expanding constantly. The model uses dividends per share (DPS), DPS growth, and necessary rate of return. Formula to calculate Gordon Growth:
P = D1 / r-g
g= Constant dividend growth predicted forever, P=Current stock price, D=Value of next year’s dividends, r= Constant Company equity capital cost (or return).
The GGM considers dividend distribution criteria and market returns to evaluate a stock’s fair value regardless of market conditions. If the model value is higher than the stock’s current market price, the property is undervalued and should be purchased, and vice versa. Company dividends per share are the annual payments made to common equity shareholders, and the growth rate is how much they increase from year to year. The necessary rate of return is the minimal rate of return investors will tolerate when buying a company’s shares. Multiple models estimate this rate.
The Gordon growth model’s fundamental drawback is its premise of constant dividend per share growth. Companies rarely grow dividends consistently due to business cycles and unanticipated financial triumphs. Thus, the approach only applies to stable-growing enterprises.
What is Gordon Growth Model (GGM)?
Investors can use the Gordon Growth Model to assess a business based on steady-growth dividends. It was first published in 1956 by University of Toronto Professor Myron Gordon. The most prevalent dividend discount model (DDM) for valuation is the GGM. It gives investors a company’s current value based on its future dividend payments, assuming a stable growth rate. The approach works best with Dividend Achievers and other solid dividend growth firms. Gordon Growth Model’s “constant WACC” assumption suggests capital markets will support “Dividend First” financing.
However, capital markets use “Debt First” financing. When a corporation uses “Debt First” financing but values it using “Dividend First” financing, the equity IRR is lower than projected. This suggests GGM overvalues a company. Overvaluation is significant—10–50% or more. Value a constant-growth corporation using the Advance Growth Model (AGM) assuming “Debt First” funding terms. If GGM assumptions are entered into the AGM formula, AGM value equals GGM value (Capitalization 2.0 – Terminal Value under Changing Capital Structure, Mike Adhikari, 2020).
What is the dividend growth model approach?
An approach that thinks dividends will always grow at the same rate. The stock’s worth is next year’s dividends divided by the variance between the needed rate of return and the projected constant dividend growth rate.
What are the three critical Inputs of the Gordon model?
The three critical Inputs of the Gordon model: The Gordon growth model uses the stock price (or market price), the estimated dividend distribution for the following year, and the needed rate of return.
What is the Gordon Growth Model well suited for?
Gordon Growth Model is well suited for established businesses that pay returns that keep going up.
Gordon Growth Model is helpful because:
- Investors use it to value a company’s shares.
- It is Simple to use.
- It can feed two- and three-stage dividend-based stock value models.
What is the Gordon growth valuation model also known as?
Gordon’s growth valuation model is also known as the dividend discount model.
How do you interpret Gordon Growth Model?
The interpretation of the Gordon Growth Model estimates a company’s share value using the dividend per share (DPS), dividend growth rate, and needed rate of return. It’s possible to make money with GGM stock if its share price is better than its market price. The shares are expensive if the calculated price is less than the market price.
What is the 2 stage Gordon Growth Model?
The two-stage growth model has an initial phase when the growth rate is not constant and a steady state where it is consistent and expected to remain constant.
The Multi-Stage Dividend Discount Model values a stock by considering higher growth rates followed by lower stable growth rates. It covers companies moving from rapid to stable growth. Stock valuation is essential for shareholders and financial experts. The Two-Stage Dividend Discount Model assists in assessing variable-growth corporations.
Simple, step-by-step instructions are provided to calculate the intrinsic value of equities that do not meet the constant growth model. Mastering this technique gives you real-world stock value insights as companies expand through different stages. This knowledge improves investment methods and informs stock investment decisions in the dynamic market.
What is the Gordon Growth Model in a DCF?
The Gordon growth model uses only three inputs to determine terminal value: discount, Cash flow, and growth rate. It also supports intrinsic value since it represents the asset’s future cash flows. Its foundation in an established valuation model makes it popular among practitioners and academics.
What is the Gordon Growth Model of private equity?
The Gordon Growth Model, often called the dividend discount model, evaluates a publicly traded stock by adding its predicted future dividend payments discounted to its present values. It assesses stocks based on their expected future dividends’ net present value (NPV).
The Gordon Growth methodology is the most widely used share price calculation methodology and, hence, the easiest to grasp. It values a company’s equity without considering market conditions, making it easier to compare companies of various sizes and industries. However, the Gordon Growth Model has drawbacks. It ignores dividend elements like brand reliability, customer retention, and intangible asset possession which boost firm value. The Gordon Growth Model assumes a constant and known dividend growth rate.
Growth stocks, which do not pay dividends, require a more general Gordon Growth Model with more assumptions. According to the concept, a company’s stock price is hypersensitive to its dividend growth rate and cannot surpass the cost of equity, which may only sometimes be accurate.
Many aspects of finance and accounting revolve around stock valuation. Analysts ‘ target prices vary despite using the same publicly available information, making equities pricing subjective. Gordon’s Growth Model shows that growth affects equity values. However, early fast growth and continuing growth to perpetuate the assumption that a corporation will grow forever need to be revised and made more sophisticated. Thus, this study suggests using the sigmoid growth curve equation to describe firm growth realities better. The sigmoid curve has lag, exponential, stationary, and declining phases. This study showed sigmoid growth patterns of Johannesburg Securities Exchange-listed companies and proposed a sigmoid growth curve-based equity valuation model. This can help estimate stock values, find mispriced stocks, and make buy/sell choices.
Curve fitting was used to determine the sigmoidity of cumulative sustainable growth patterns of 64 JSE-listed companies from 1994 to 2014. Interestingly, 50% of enterprises grew sigmoid. By replacing growth, g, in the Gordon Growth Model with sigmoid equation parameters, a model for pricing equities was created. This study concludes that the Gordon Growth Model for stock valuation must account for enterprises’ complicated growth criteria to avoid mispricing shares (Capital Equity Valuation Meets the Sigmoid Growth Equation: The Gordon Growth Model Revisited, E. Madoroba, J. Kruger, 2015).
Formula to calculate the Gordon Growth Model of private equity:
P = D1/ (r-g)
Let’s say a company’s stock costs $220. The corporation wants a 7% return (r) and will issue a $4 dividend next year. Investors estimate 5% growth (g).
The intrinsic value is calculated:
P = $4/ (7%-5%) = $200
The foregoing computation shows that the stock’s current value is $200, and its market value is $220. Thus, the stock trades at $20 over its intrinsic value, which is why the Gordon Growth Model says it is overvalued.
The Gordon Growth Model (GGM) simplifies estimating a company’s share price. As mentioned, the single-stage model requires only a few assumptions, but high-growth enterprises with shifting capital structures, dividend distribution policies, etc., tend to limit its accuracy. If a business has been making money and paying its employees for a long time, the GGM works well for them. The GGM assumes dividends will rise at the same rate forever, its biggest weakness. As market risks arise, organizations and their business models change significantly.
The model best applies to mature, established companies with continuous dividend increases because it assumes dividends rise forever. Another worry for GGM dependency is that failing businesses can provide big dividends to themselves (e.g., reluctance to cut dividends) notwithstanding financial decline. A gap between the company’s economics and dividend policy can emerge, which the GGM would miss.
What are the properties of the Gordon Growth Model?
The 4 basic properties of the Gordon growth model are:
- It’s easy to understand and use.
- It is an excellent way to determine how much an old, dividend-paying company is worth.
- It’s used to determine if a stock market’s price is fair.
- For a proliferating company, it is utilized to model the last stage of growth in a model with more than one stage.
What is the Gordon Growth Model perpetuity?
The perpetuity of GGM is that Gordon Investors often use the growth model to value stocks. The 1950s invention by Myron J. Gordon and Eli Shapiro holds that a stock’s worth equals its future dividends. A popular technique in financial analysis, the model predicts stock returns.
The Gordon Growth Model is a simple model investors use to calculate stock intrinsic value. The calculation considers the predicted return, and dividend per share. The formula is:
Intrinsic Value = D / (r – g)
A major benefit of the Gordon Growth Model is its simplicity. The formula is simple and suitable for novice investors. It also helps long-term investors expand their money steadily. Another benefit is that the Gordon Growth Model considers dividend growth. This helps investors predict their investments’ future value. The technique helps compare equities and discover undervalued or overvalued ones. The below video talks about valuing stocks based on future dividends.
The Gordon Growth Model has drawbacks investors should know about. Its consistent dividend increase assumption is a significant drawback. The model may need more accuracy since dividend growth rates vary over time. The model does not account for market or economic variables that can alter stock prices. Variations in the required rate of return, which is hard to estimate, affect the model.
In finance, a continuous stream of equal payments is called perpetuity. It is critical to value cash-flowing assets, especially in the Gordon Growth Model. This methodology calculates a stock’s worth by adding its current dividend and the present value of all future dividends, depreciated at a risk-adjusted rate. This method assumes that the stock will pay dividends indefinitely; therefore, its value may be estimated as the sum of an infinite number of cash flows.
Perpetuity is the sum of a steady cash flow divided by an investment risk discount rate. Its mathematical expression is:
PV = C/r,
PV is perpetuity present value, C is constant cash flow, and r is the discount rate. If a stock produces a $2 dividend and the discount rate is 10%, the perpetuity’s present value is $20 ($2/0.1). The Gordon Constant Growth Model and perpetuities are used differently, with no real growth and projected inflation (Return to Fundamentals, Ignacio Vélez-Pareja, 2008).
What is the cost of equity using the Gordon Growth Model?
The discount rate is the cost of equity as the GGM affects equity holders. If the predicted DPS is not given, multiply the current DPS by (1 + Dividend Growth Rate %) to determine the numerator.
What is the dividend growth model for WACC?
To compute WACC, multiply the cost of each capital source (equity and debt) by its weight and sum the products. The Gordon Growth Model (Dividend Discount Model) estimates a stock’s intrinsic value, excluding market conditions. The model compares this to a stock’s projected dividends. Three business valuation methods Market (see related asset values) Income (DCF, earnings capitalization) FMV of intangible, tangible, and liabilities assets
What is the required return in the Gordon Growth Model?
When investors purchase a company’s stock, their desired rate of return is the lowest rate they are ready to accept. There are different ways for investors to figure out this rate.
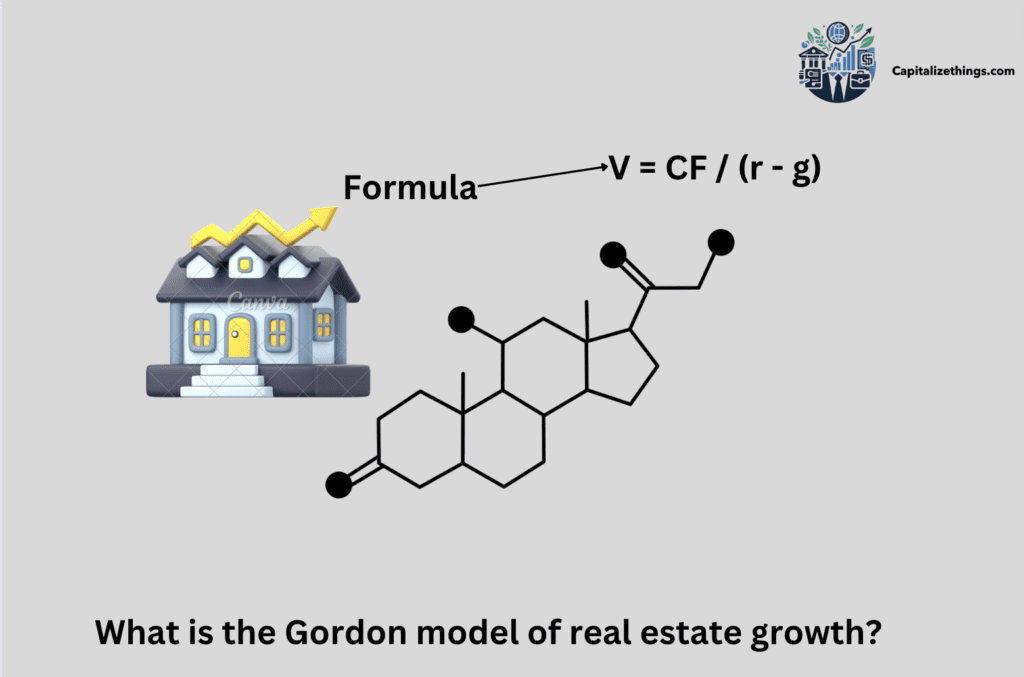
What is the Gordon model of real estate growth?
The Gordon Growth Model for real estate assumes that property values or rental income will grow at a constant rate indefinitely. The basic formula is:
V = CF / (r – g)
Where:
V = Present value of the property
CF = Expected cash flow for the next year (often net operating income)
r = Required rate of return (or capitalization rate in real estate terms)
g = Expected constant growth rate of cash flows
Researchers use the dynamic Gordon growth model to analyze the housing market in 23 US urban areas, four Census regions, and the nation from 1975 – 2007. The model splits the rent-price ratio at each date into predicted accurate interest rates, present discounted rent growth, and a housing premium over accurate rates. They demonstrate that housing premiers are changeable and forecastable and contribute significantly to rent-price ratio instability at the national and local levels and that covariance among all 3 components dampens variations. Thus, house-price dynamics are explained solely by interest rate fluctuations, and ignoring this covariance can be deceptive. Similar findings were obtained for equities and bonds (What moves housing markets: A variance decomposition of the rent-price ratio, S. D. Campbell, Morris A. Davis, Joshua Gallin, 2009).
What is the FCF growth rate?
Free cash flow growth rate, is the amount left over after paying for operations and capital purchases, is the best way to judge a company’s financial health. This measure is a reality check for your finances because it only looks at cash, which is the best way to tell if your finances are stable. For example, using FCF for payouts shows that the focus is on the shareholders, while reinvestment shows that the goal is to grow. In either case, how a business spends its free cash flow can tell you much about its long-term goals and financial health. For investors, a company that consistently produces strong free cash flow (FCF) is a good investment because it can pay for its growth and give value to its shareholders.
Formula to calculate FCF:
Free Cash Flow (FCF) = Operating Cash Flow − Capital Expenditures
What is the constant growth rate model?
The Constant Growth Model evaluates shares. Also known as the Gordon Growth Model, it suggests that corporate dividends will grow at a consistent pace. It helps investors price a stock now based on future dividends. A formula for a corporation paying a continually rising dividend can determine the stock’s fair value based on the distribution.
P = D / (r – g)
The Required Rate of Return (RRR) is the least investment return investors will tolerate to keep the stock. Despite its simple growth formula, the Gordon Growth Model has numerous drawbacks
.
They estimate errors when computing share value in the Gordon Growth Model, which is crucial. Multiple shares must be considered when calculating value. This decreases stock fair value estimation errors. The share fair value formula should be used for something other than a fast-growing corporation. A continuous growth formula assumes growth is sustainable forever.
Thus, presuming high growth rates may lead to inaccurate evaluations. When Gordon Growth Models are applied to an overstated share, declining growth rates are overlooked once the growth rate matures and becomes constant. Market estimates for a stock’s fair value may differ from Gordon Growth Model estimates. This does not invalidate the formula. It suggests the dividend stream was miscalculated.
What are the zero growth model and the constant growth model?
The zero-growth plan says the dividend doesn’t change over time, so it’s always the same. The stock price would then be equal to the annual dividends split by the rate of return needed. The method used to find the current value of perpetuity can also be used to figure out the price of preferred stock, which has a dividend equal to a certain percentage of its face value. Even if the zero-growth model is used, the cost of a stock can still change if the needed rate changes as the risk changes.
The Gordon Growth Model / the constant-growth dividend discount model says that dividends should grow by a certain amount every year. How much Google, Facebook, Amazon, and Twitter are worth using this method? Of course not! This is because these businesses don’t pay rewards. They are also growing a lot faster, which is even better. Models that use constant growth can be used to value mature companies whose profits have been steadily rising.
What is the variable growth dividend valuation model?
Variable-growth dividend valuation models use future payouts minus capital gain growth to value stocks. It provides valuable information because it explains how most businesses grow. It is not valid if the growth rate ever goes above the minimum rate of return. It says that the rate of payout growth will change forever. Growth stock is different from revenue stock in the following ways:
- Payout ratio and PE ratio are both low.
- It is not dangerous and does not have too much PB.
- A high dividend yield and a high payout percentage.
- A low payout ratio, a high PE ratio, and a lot of danger
What does the Gordon Growth Model show?
The Gordon Growth Model, also known as the dividend discount model, is a way to determine a stock’s real worth. This method needs to take into account the current market conditions. Investors can use this simple model to compare companies in the same industry.
What is the relation between Gordon Growth Model and the Price-to-Earnings Ratio?
The price-to-earnings ratio (P/E) is the most well-known way to determine a product’s worth. A P/E multiple can be made using the Gordon growth model. A justified basic P/E multiple is found when predicted inputs are used in the multiple. Current P/E or leading P/E can be used to discuss P/E.
What is the formula of the growth model?
Formula for growth model:
P = D1/(R-g)
P is the stock price, D1 is the dividend per share for the following year, R is the needed rate of return, and g is the dividend growth rate. This is the Gordon Growth Model equation.
What is the K in Gordon Growth Model?
K in the Gordon Growth Model is the cost of equity.
What is the formula for the constant dividend growth model?
Formula for constant dividend growth model:
P = D (k − g)
How do you calculate WACC using the Gordon Growth Model?
When calculating WACC, multiply the cost of each capital source (equity and debt) by its weight and add.
How to calculate the dividend growth model in Excel?
To calculate the dividend growth model in Excel:
[(Ending Dividend per Share / Beginning Dividend per Share) ^ (1 / Number of Years) – 1]
How do you calculate equity risk premium?
Equity risk premium equals projected market return minus the risk-free rate.
What is the formula for the Gordon Growth Model using Roe?
The dividend growth rate can be evaluated by multiplying ROE by Retention Ratio. Divide firm net income by shareholder equity to calculate return on equity. Shareholders equity is on the balance sheet, while net income is on the income statement. In contrast to the dividend payout ratio, the retention ratio is the percentage of net income maintained in the business. Divide the company’s retained earnings by its net income. The company’s balance sheet shows retained earnings and net income statements.
How do you forecast the free cash flow growth rate?
To forecast free cash flow growth rate:
For each year of the forecast time frame, use the method to calculate the company’s Free Cash Flow (FCF):
Revenue – COGS – OPEX – Taxes + D&A – CAPEX – Change in WC.
It would help if you also determined the company’s efficient tax rates using historical or legal rates. Divide real tax paid by EBT to get the effective tax rate. Follow these steps to forecast FCF for DCF value. However, this approach is sensitive to presumptions and inputs, which are challenging in predicting future performance and cash flow. It requires estimating a terminal value or growth rate beyond the forecasting period and discounting the FCF by an appropriate discount rate or cost of capital.
What is the difference between Gordon Growth Model and CAPM?
The Gordon Model values equities based on dividend growth, while the CAPM uses the risk-free rate, market risk premium, and systematic risk index. The analysis showed that the dividend payout strategy affects the Gordon Model and CAPM predicted returns. Company financial plan performance depends on expected returns, stock valuation techniques, and capital structure management.
A sample portfolio is examined to determine how the anticipated rate of return is assigned, common stock is valued, and the firm’s capital structure targets equity and debt. An algorithm that prices common stock must accurately estimate projected return. Company capital acquisition and dividend policy may affect return. Capital asset pricing model (CAPM) evaluates factors affecting projected return and stock value. They used the Gordon constant growth model to value the model portfolio and match its predicted returns to the CAPM (Expected return, stock valuation, and the capital structure, J. Mark Smith, 2023).
What key assumptions does the Gordon Growth Model make?
Following are the key assumptions that gordon growth model make:
- Constant Dividend PayoutPayout Ratio
The Gordon growth Model assumes a company’s dividend payment ratio stays constant. This signifies that the company’s dividend payout percentage will remain constant regardless of earnings growth or other factors. This assumption may apply to certain companies but not all. A fast-growing company can use its earnings rather than pay dividends, and the Gordon Growth Model may not work in such instances.
- Constant Earnings Growth Rate
Second, the Gordon Growth Model assumes a company’s earnings growth rate will stay constant. This implies that a company’s earnings growth rate will always be steady. This assumption may not apply to all companies. Industry, competitors, and economic conditions can affect a company’s earnings growth. Before adopting the Gordon Growth Model, a company’s earnings growth rate must be assessed for sustainability.
- Discount Rate
The Gordon Growth Model’s third assumption is a constant discount rate for cash flow forecasting. Discount rates are the returns investors need to buy stocks. However, interest rates, inflation, and market risk affect discount rates. Thus, the discount rate is crucial when using the Gordon Growth Model.
- No Debt
The fourth idea behind the Gordon Growth Model is that the business owes no money. This assumption simplifies future cash flow present value calculations. In truth, most organizations have debt, and the Gordon Growth Model must be adjusted to account for that debt.
The Gordon Growth Model’s assumptions must be thoroughly reviewed before using it to value a stock. Before adjusting the model, investors should assess a company’s dividend payout ratio, discount rate, earnings growth rate, and debt levels. By doing so, investors can better grasp a stock’s intrinsic value and make informed investments.
How do you derive Gordon’s growth model?
To drive Gordon’s growth model:
Divide the period’s DPS by (Required Rate of Return – Expected Dividend Growth Rate).
What is the formula for terminal value in the Gordon Growth Model?
To estimate terminal value using the Gordon growth model, use the formula for the cash flow stream. For instance, to value a project with free cash flow (FCF), apply the formula:
Terminal value = FCF / (WACC – Growth rate)
What is the formula for geometric growth rate?
The equation defines geometric growth:
yt = y0(1=r)^t
What are the common gordon Growth model problems and their solutions?
The common gordon Growth model problems are that the model’s constant dividend increase and unlimited growth assumptions can only be practical for some companies. The model is also affected by discount and growth rates. Having these limitations, the Gordon Growth Model is simple and intuitive for valuing equities based on predicted future dividends. The concept works well for steady, mature companies with extended dividend and growth histories.
Figure out different growth rates for different time periods, or use a multi-stage DDM if you think growth will change. Gets the needed rate of return using the Arbitrage Pricing Theory (APT) or Capital Asset Pricing Model (CAPM). Market data-based models can make more accurate estimates.
The analysis of sensitivity shows how inputs affect model outcomes. This helps evaluate valuation robustness under different conditions. Discounted Cash Flow (DCF) / Earnings Multiple Approach (P/E ratio) valuation techniques can be better for non-dividend-paying stocks. Estimate projected growth using industry benchmarks, past growth, and fundamental analysis. Examine qualitative growth elements like technology and market trends.
What is the market risk premium in the dividend growth model?
Market risk premium (MRP) is the difference between the market portfolio’s expected return and the risk-free rate. The security market line gradient (SML) gradient, a capital asset pricing model graph, equals the market risk premium. CAPM evaluates equity investment returns and is used in modern portfolio theory (MPT) and discounted cash flows (DCF) assessment.
What is the difference between the dividend growth and discount models?
DDM assumes that a stock’s current value is the sum of its upcoming dividend payments discounted back to the current at a specified rate. GGM, or the Gordon Growth Model, minimizes this technique by assuming constant growth during perpetuity. To calculate a stock’s current value, divide the next year’s estimated dividend by the difference between the needed rate of return and the growth rate.
Many assumptions underlie DDM and GGM. DDM anticipates consistent dividend growth indefinitely, which may only be valid for some corporations. By design, GGM presupposes everlasting growth, which may not be possible. GGM is better for established, steady dividend-paying enterprises, while DDM can be used for more. Choosing the proper model requires understanding these assumptions and constraints.
A hypothetical case will show the differences between DDMs and GGMs. Consider Company A, a long-standing utility with stable dividends. DDM may be a good way to value a stock because it takes into account how dividends have grown over time. Company B, a tech start-up with unknown payouts but significant growth potential, could be better valued using GGM if it grows steadily.
Conclusion
The Gordon Growth Model assumes a company’s shares are worth the total of its future dividends discounted to their present value. The Gordon growth model considers dividend payout parameters and market returns to evaluate a stock’s fair value regardless of market conditions. The stock is recommended if its GGM value exceeds its market price. GGM is commonly used to value stocks but can also be used to evaluate real estate, pensions, and farmland. You only need an asset with a predetermined growth rate and return you can anticipate accurately.
The GGM can be used to calculate the value of an account for savings, where the yield is expected interest. Overvalued stocks should be sold if their value is lower than their market price. The relationship between the discount factor and model growth rate must be revised. The model is meaningless if the required rate of return is less than the dividend per share growth. If the required rate of return matches the growth rate, the share price approaches infinity.

Larry Frank is an accomplished financial analyst with over a decade of expertise in the finance sector. He holds a Master’s degree in Financial Economics from Johns Hopkins University and specializes in investment strategies, portfolio optimization, and market analytics. Renowned for his adept financial modeling and acute understanding of economic patterns, John provides invaluable insights to individual investors and corporations alike. His authoritative voice in financial publications underscores his status as a distinguished thought leader in the industry.

